This page documents the Mars Mission as an engineering-style project, organised into stages, checkpoints, deliverables, and the skills developed along the way.
Mission Timeline
Three stages from concept to completion
01
Stage 1
Mission Concept
•Define the mission goal.
•Explain the basic Mars mission idea.
•Identify the main challenges: distance, travel time, fuel, safety, and communication.
◆ Checkpoint Review
Show the mission idea, early research, and initial project plan.
Mission Idea
The Design a Mars Mission project is an educational software simulator that shows how a spacecraft could travel from Earth to Mars.
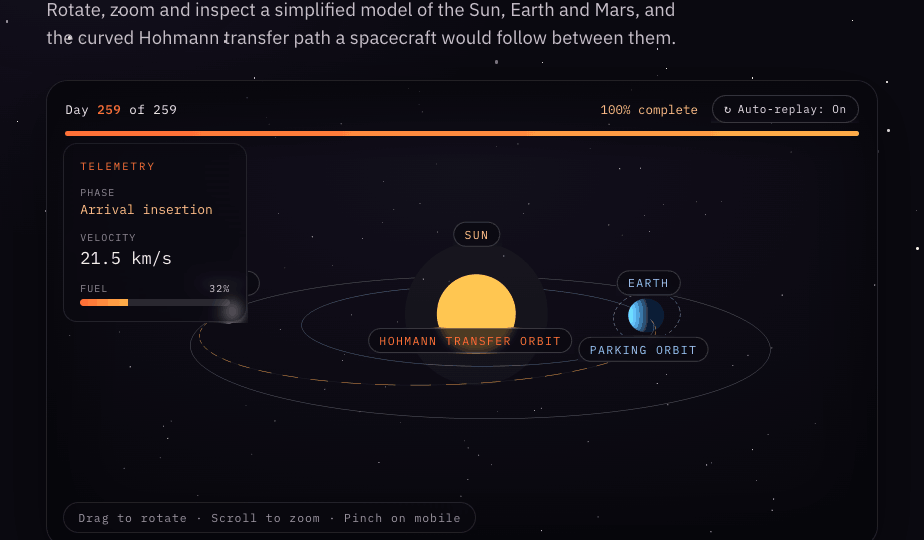
The final project is a Docker-runnable Next.js web app that visualises a simplified Earth-to-Mars mission, showing Earth, Mars, a spacecraft, and the transfer path between the planets. It connects the visual simulation to real maths and engineering ideas, so the user can see both the mission animation and the calculations behind it.
Key Concepts Applied
01
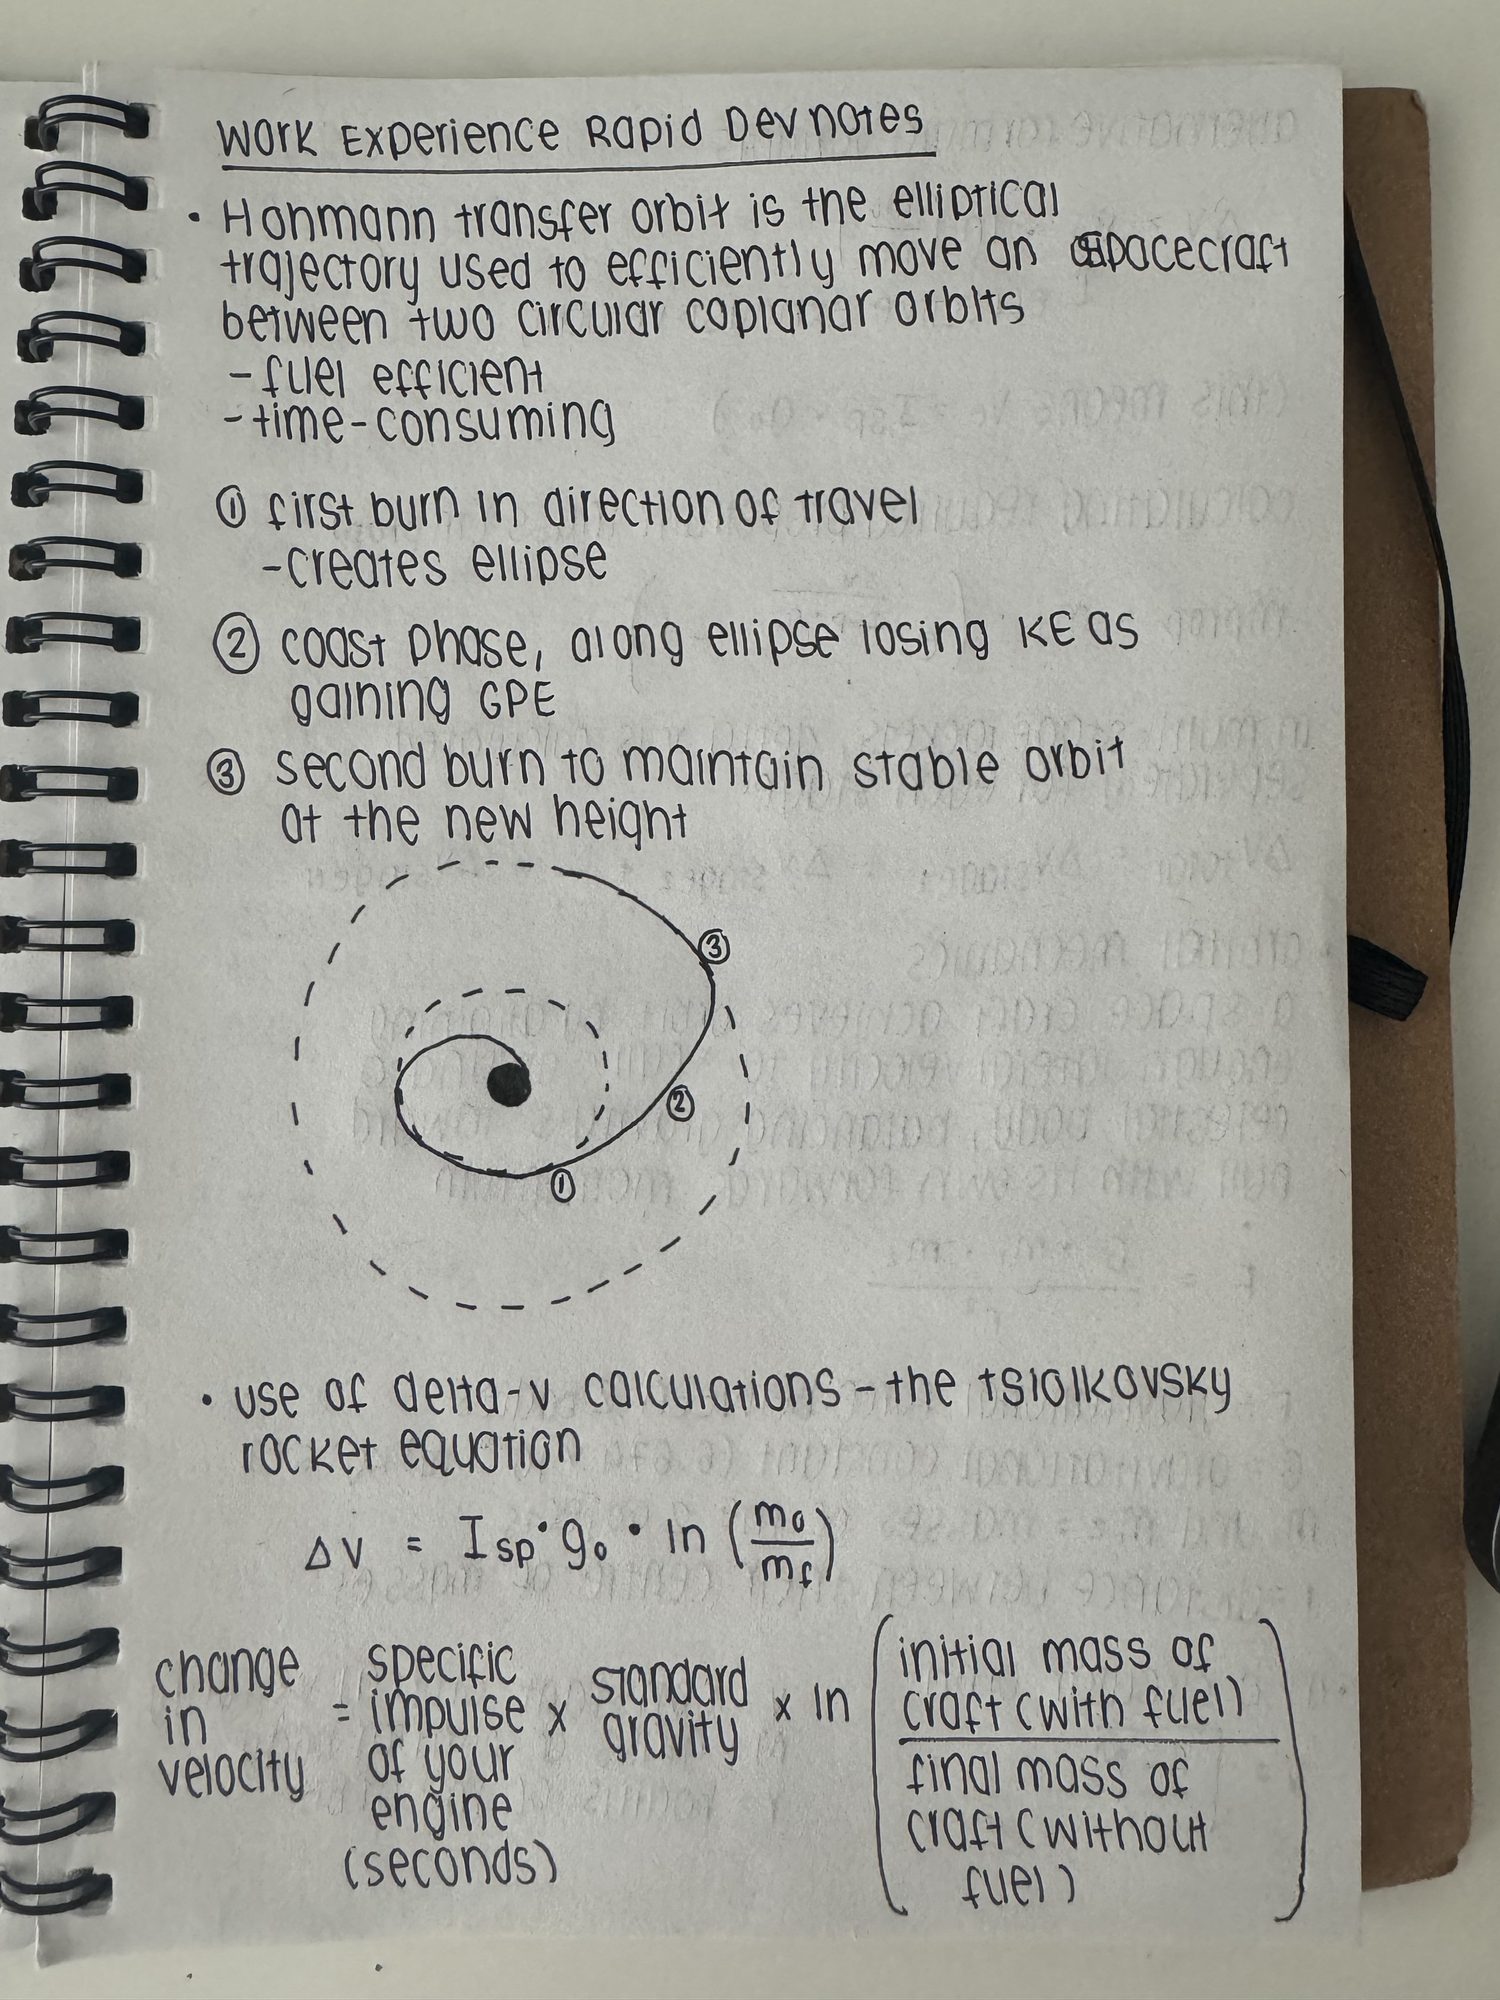
Hohmann transfer orbit
A fuel-efficient path from Earth’s orbit to Mars’s orbit. Applied when the app draws the curved mission path, showing missions follow orbital paths around the Sun, not straight lines.
02
Delta-v calculations
The change in velocity needed to move between orbits. Applied in the maths panel to calculate and explain how much velocity change is needed to begin the journey and reach Mars’s orbit.
03
Tsiolkovsky rocket equation
Connects spacecraft mass, fuel mass, engine efficiency and delta-v. Applied to show engineering trade-offs, more fuel adds mass, which can make the mission harder.
Mission Goal · Student Perspective
Build an impressive Mars mission simulator that shows I can connect maths, engineering, software development and AI-assisted development in one project. It should demonstrate that I can:
•Understand and explain real space mission concepts.
•Use maths formulas in a practical software project.
•Turn calculations into a visual 3D simulation.
•Think like an engineer by considering trade-offs and mission risks.
•Use AI tools to help plan, build and improve the project, while still understanding the output.
•Package the final app with Docker so it can be run and demonstrated easily.
This project is not just about a good-looking website. It is about showing how software can explain a real engineering problem.
Main Mission Challenges
Distance
Mars is very far, and the distance changes as both planets orbit the Sun. The craft must aim for where Mars will be on arrival, not where it is at launch.
Travel time
A Mars mission takes months. The craft must follow a planned orbit and arrive when Mars is in position, and a faster route requires much more fuel.
Fuel
Fuel adds mass, and extra mass is harder to move, so a mission can’t add unlimited fuel. Explained through delta-v and the rocket equation.
Safety
Long travel, equipment failure, radiation and limited supplies mean astronauts need reliable life-support, navigation, power and communication systems.
Communication
Signals take minutes to travel between Earth and Mars, so a craft can’t rely on instant contact, so real missions need autonomous systems.
Checkpoint Summary
This checkpoint shows the project has a clear purpose, early research, and a realistic engineering direction. It applies Hohmann transfer orbits, delta-v, the Tsiolkovsky rocket equation and basic orbital mechanics to build a visual mission simulator. The challenges of distance, travel time, fuel, safety and communication guide the design of the software simulator and explain why a Mars mission is a complex engineering problem.
02
Stage 2
Maths, Engineering & Software Design
•Use maths to explore distance, speed, travel time, fuel needs, launch windows, or orbital transfer concepts.
•Use engineering thinking for spacecraft design, astronaut safety, resources, and mission risks.
•Use software to organise information, create calculations, build simple simulations, or present the plan.
◆ Checkpoint Review
Show calculations, diagrams, design decisions, and early software or prototype work.
Stage 2 · Maths-Driven Mission Simulator
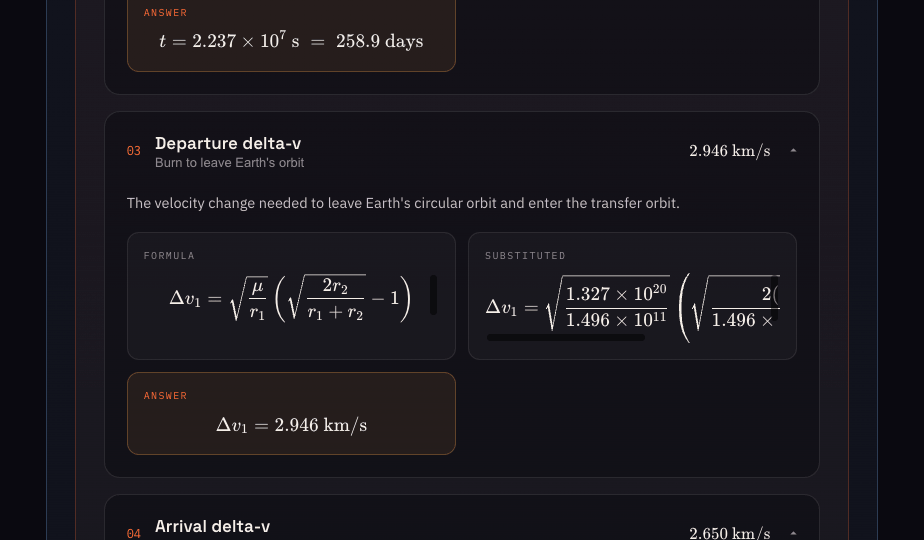
During Stage 2, the project developed from a basic 3D model into a calculation-driven mission simulator. Real orbital mechanics formulas are now used to estimate the Earth-to-Mars transfer path, travel time and required delta-v.
The calculated results are shown in a maths panel and connected to the visual scene. The spacecraft follows the generated transfer orbit, and the mission day and completion percentage update as the animation progresses. Mission inputs can be changed so the viewer immediately sees how different assumptions affect the journey.
What Changed Since Stage 1
01
Stage 1 · Visual concept
–Basic 3D scene
–Sun, Earth and Mars
–Planetary orbit rings
–Camera controls
–Initial mission concept
02
Stage 2 · Maths-driven simulator
•Real Hohmann transfer calculations
•Maths panel with formulas and substituted values
•Calculated transfer duration and delta-v
•Transfer path generated from calculation data
•Spacecraft animation linked to the calculated journey
•Mission day and progress tracking
•Interactive mission assumptions
•Clearer explanation of the mission sequence
Stage 2 · Reflection
Making this website has been the part of the project where the maths and engineering ideas turned into something I could actually see and explain. I began with a plain 3D scene, and by wiring it up to real calculations I came to understand how the numbers behind a Mars mission actually shape the journey.
The biggest lesson was that the visualisation only means something when it is driven by the maths. Getting the calculated results to generate the transfer path and control the spacecraft, instead of faking a curve, is what turned a nice-looking model into a genuine simulator.
What I Learned Building It
•How to build a responsive, multi-page website with navigation that works on both desktop and mobile.
•Connecting maths to visuals, using calculated results to generate the transfer path and drive the animation rather than hard-coding it.
•The orbital mechanics of a Hohmann transfer, and how the semi-major axis, transfer time and launch geometry fit together.
•Working with delta-v and the Tsiolkovsky rocket equation to see how velocity change trades off against fuel and mass.
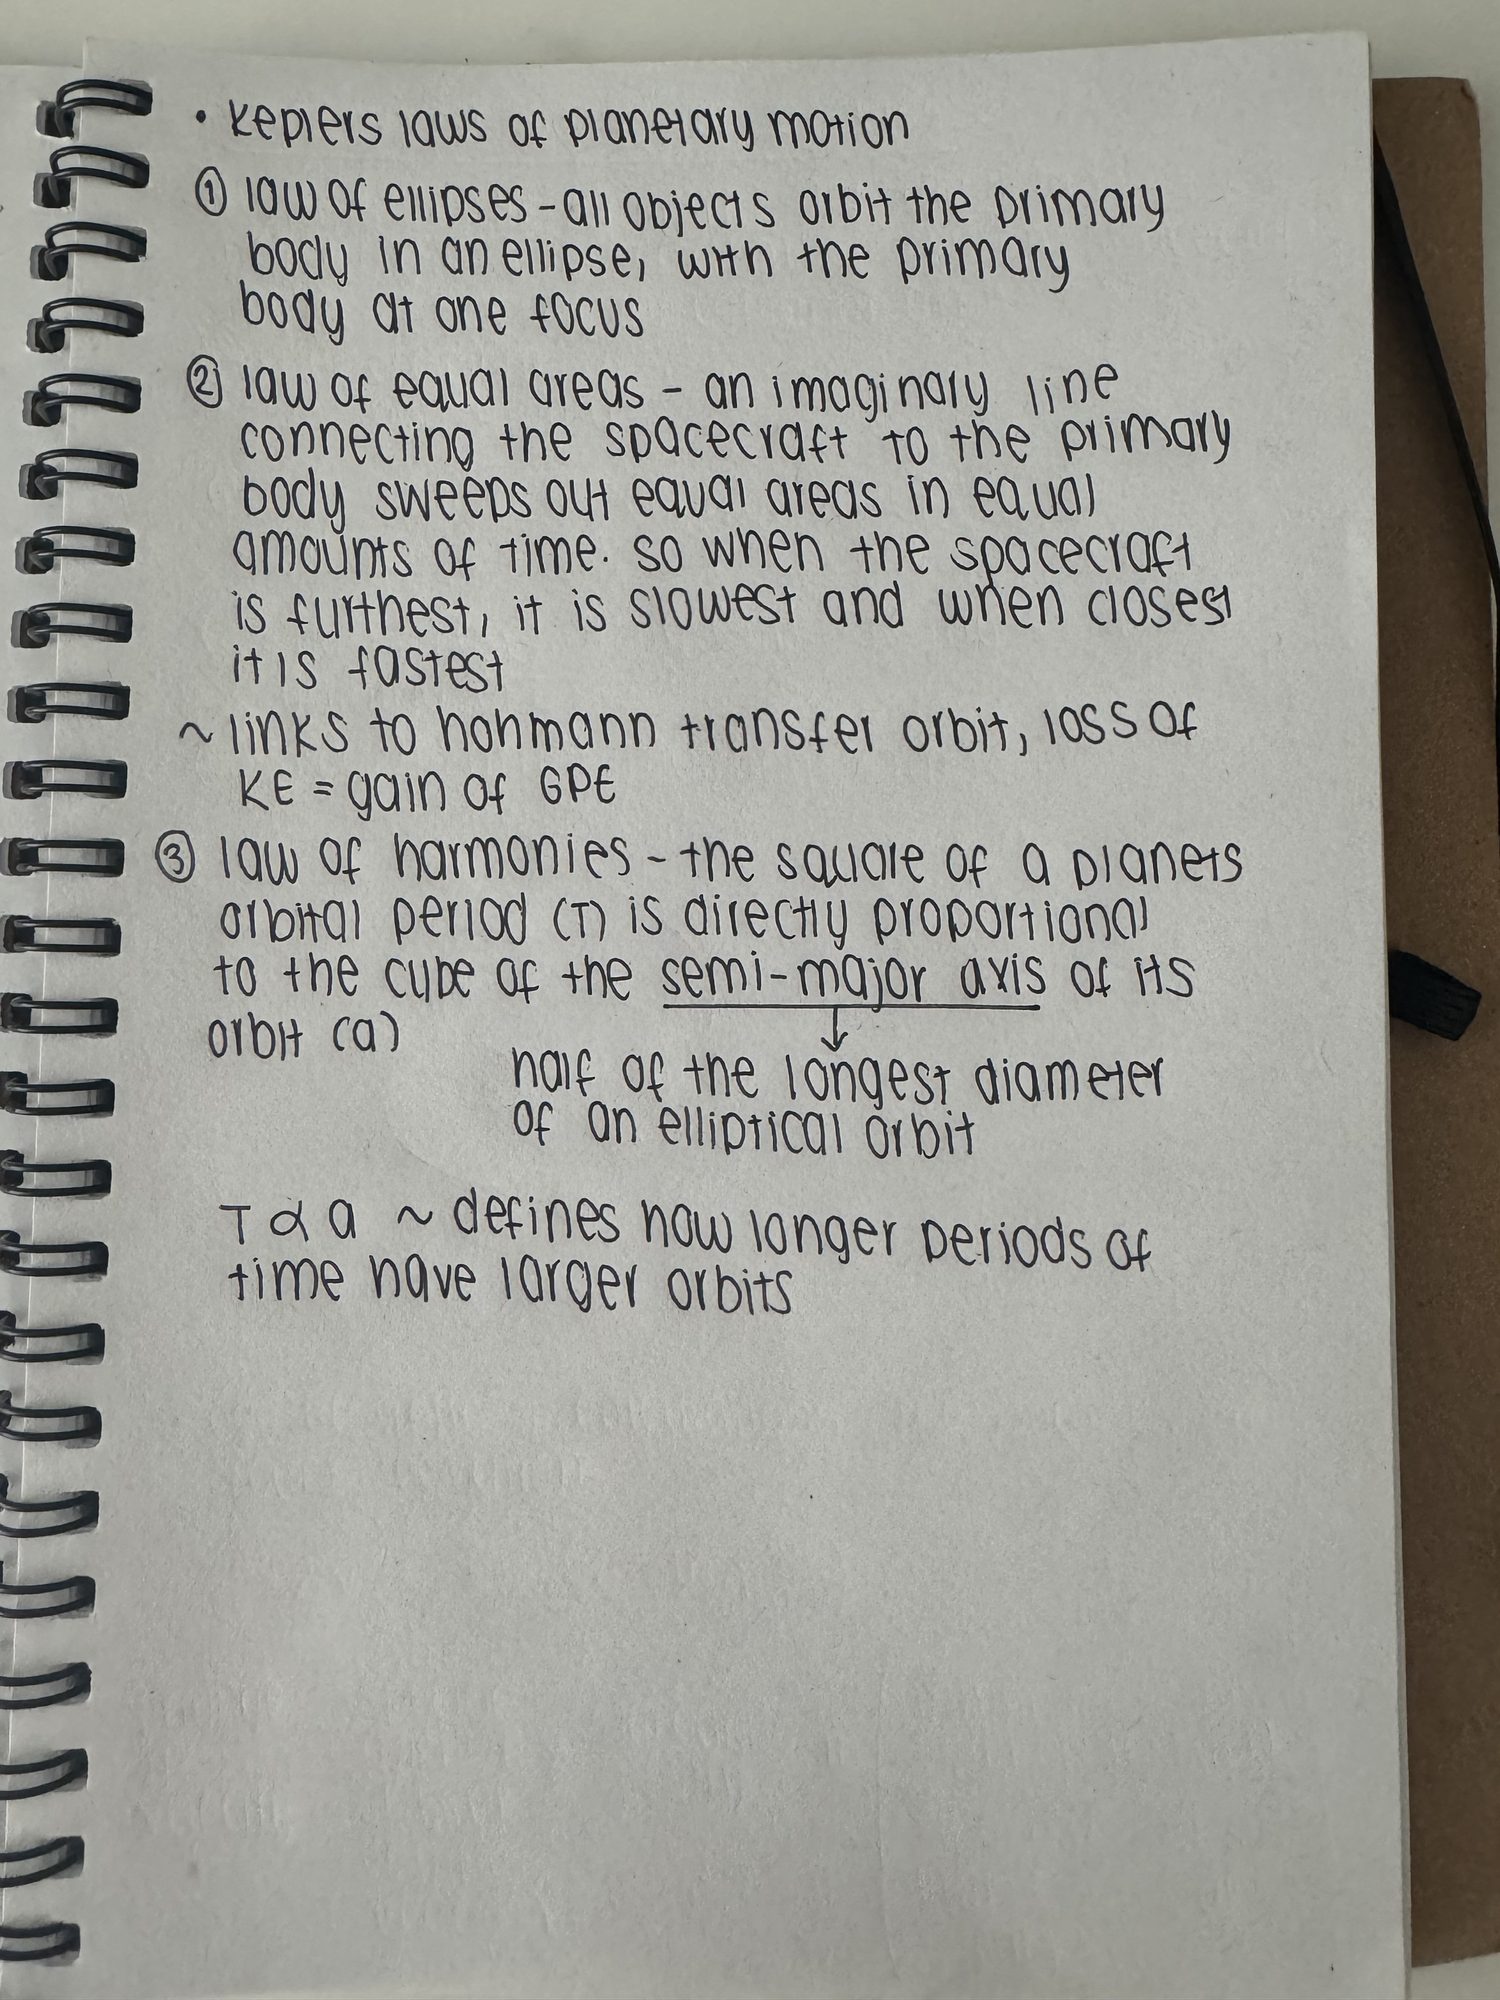
•Why Kepler’s laws of planetary motion mean spacecraft follow curved orbital paths around the Sun instead of straight lines.
•Using AI as a development tool, planning, prompting, reviewing and correcting its output while still understanding the code and the physics behind it.
•Explaining technical work clearly so that someone without a science background can follow it.
Research Evidence
Photos of my own handwritten research notes behind the mission maths. Tap an image to open it full size.
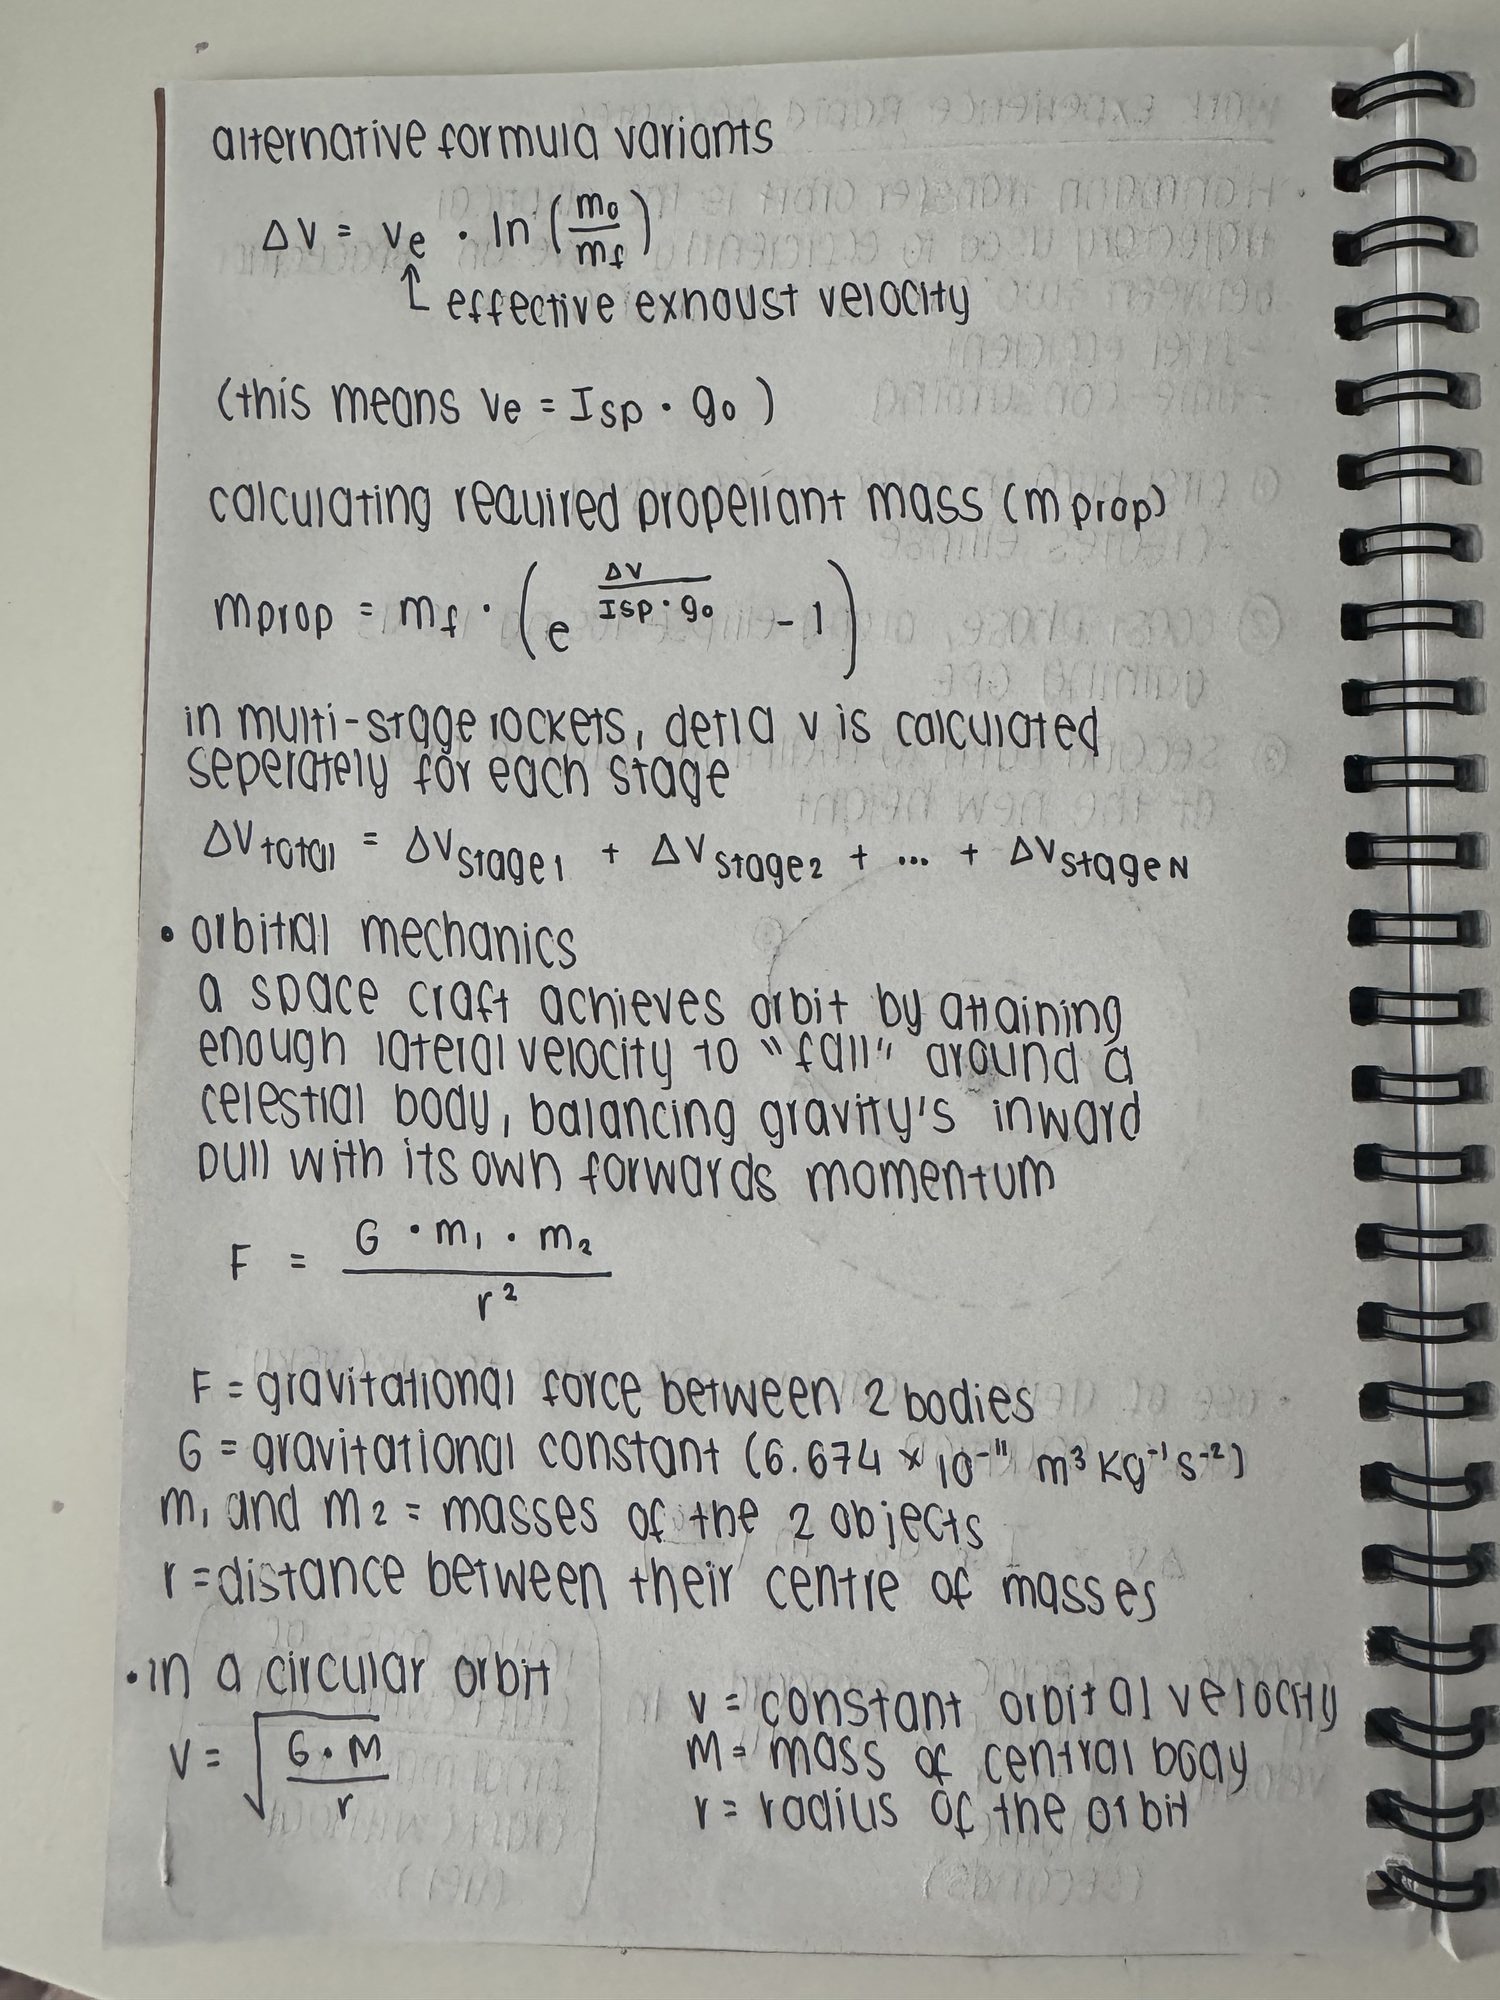
Hohmann transfer & delta-v: the three-burn transfer sequence and the Tsiolkovsky rocket equation broken down.Rocket equation & orbital mechanics: propellant mass, multi-stage delta-v, Newton’s law of gravitation and circular-orbit velocity.Kepler’s laws of planetary motion: ellipses, equal areas, and the T² ∝ a³ law behind curved orbital paths.
At the end of Stage 1, and again at the end of Stage 2, I gave a short presentation and explanation summarising the work and development completed on the page, walking through what had changed since the previous checkpoint and demonstrating the simulator live.
Screenshots
Screenshots of the live simulator captured for the Stage 2 checkpoint. Tap an image to open it full size.
1 · Maths panel
Show a formula, substituted values, transfer time and a delta-v result, with the input controls where possible.
“Stage 2 maths panel showing the orbital formulas, mission values and calculated results.”
2 · Transfer orbit & spacecraft
Earth, Mars, their orbit rings, the calculated transfer path and the spacecraft on that path.
“Calculated Earth-to-Mars transfer path used by the spacecraft animation.”
3 · Changed assumptions (optional)
After changing one input: results update, the path changes and progress stays synchronised.
“The simulator recalculates the mission when an input value changes.”
Checkpoint Summary
This checkpoint shows the project has moved from a visual prototype to a maths-driven simulator. Real Hohmann transfer calculations now produce the transfer path, journey time and delta-v, and these results drive the 3D scene, the spacecraft animation and the mission progress tracking. Changing an input recalculates the whole mission live, proving the visualisation is powered by the maths rather than a fixed effect. The next stage will focus on improving the presentation, accuracy, interaction and overall user experience.
03
Stage 3
Final Mission Presentation
•Bring the project together into a clear final mission proposal.
•Present the maths, engineering choices, software work, and final conclusions.
•Prepare and deliver the final presentation.
◆ Checkpoint Review
Show the finished landing page, project pages, final deliverables, screenshots, and presentation material.
Stage 3 · Final Mission Presentation
During Stage 3, the project came together into a complete final showcase. The maths-driven simulator gained an engineering layer that judges whether a mission is actually sensible, and the whole site was pulled into one place ready to present.
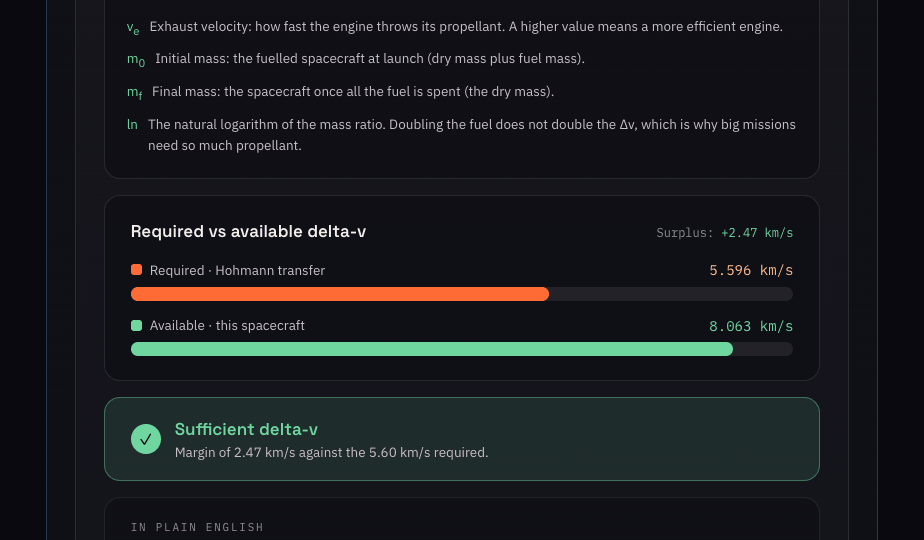
The simulator now compares the delta-v a spacecraft can produce against the delta-v the transfer needs, and reports a clear verdict of feasible, risky or impossible. Engineering trade-off cards explain the balance between fuel, engine efficiency, journey time and risk. A new Presentation page brings the deck, the demo script and a readiness checklist together, and the thirteen-slide presentation is exported as a downloadable PowerPoint.
What Changed Since Stage 2
02
Stage 2 · Maths-driven simulator
–Real Hohmann transfer calculations
–Maths panel with formulas and delta-v
–Transfer path generated from the maths
–Interactive mission assumptions
–Mission day and progress tracking
03
Stage 3 · Final showcase
•Tsiolkovsky rocket equation for available delta-v
•Required vs available delta-v comparison chart
•Feasible / Risky / Impossible mission status
•Engineering trade-off cards (fuel, engine, time, risk)
•Presentation page with a five-minute demo script
•Readiness checklist saved in the browser
•Thirteen-slide deck exported as a PowerPoint
•Full project README documentation
Stage 3 · Reflection
Stage 3 was where the project stopped being just a calculator and started behaving like a real engineering exercise. Adding the delta-v comparison and the feasibility verdict made me think about the mission the way an engineer would: not whether a number can be produced, but whether the design leaves enough margin to be safe.
The biggest lesson was that presenting the work is part of the engineering. Building the trade-off cards, writing the demo script and preparing the deck forced me to explain every decision simply, and that made me understand the maths and the compromises far better myself.
What I Learned Building It
•How a safety margin turns a raw delta-v figure into a real decision, and why a mission can be mathematically possible yet still too risky.
•How engineers balance competing priorities, more fuel raises delta-v but adds mass, and a faster journey costs more energy.
•How to compare available and required delta-v visually so a non-technical viewer can see at a glance whether a mission works.
•How to turn a whole project into a timed presentation, sequencing the demo and choosing which formula and which change to show.
•How to document a project in a README so someone new can understand how it works, how to run it and how AI supported the build.
At the end of each stage I gave a short presentation and explanation summarising the work completed, and for the final checkpoint I walk through the finished simulator live, demonstrate the engineering trade-offs and mission status, and present the thirteen-slide deck.
Deliverables
Final deliverables checklist
✓Mission overview
✓Maths calculations
✓Engineering design notes
✓Software or prototype work
✓Project timeline
✓Final presentation
✓Evidence / screenshots
✓Reflection on learning
Capabilities
Skills demonstrated
Maths Skills
Distance, speed, time, scale, estimation, and fuel or orbital transfer calculations.
•Hohmann transfer semi-major axis, transfer time and departure/arrival delta-v.