Design a Mars Mission
Final Showcase
One place that brings together the completed mission simulator, the project presentation, the five-minute live demo, and the presentation-day readiness checklist.
Design a Mars Mission
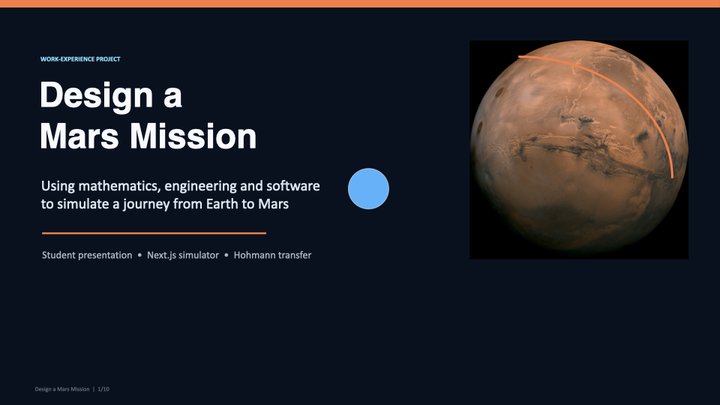
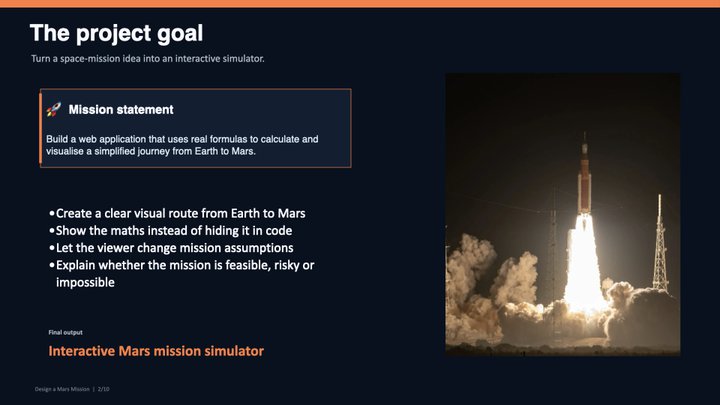
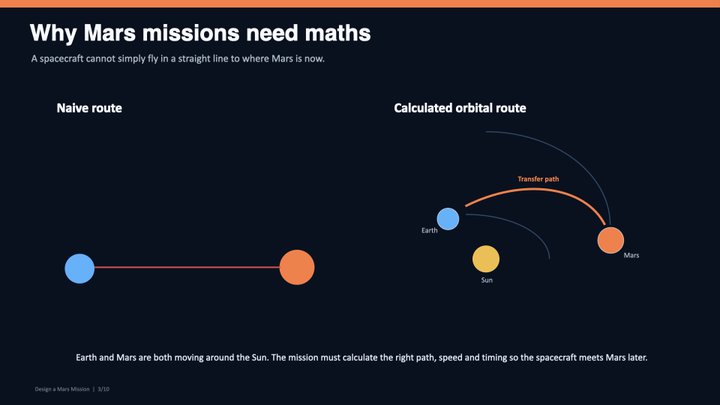
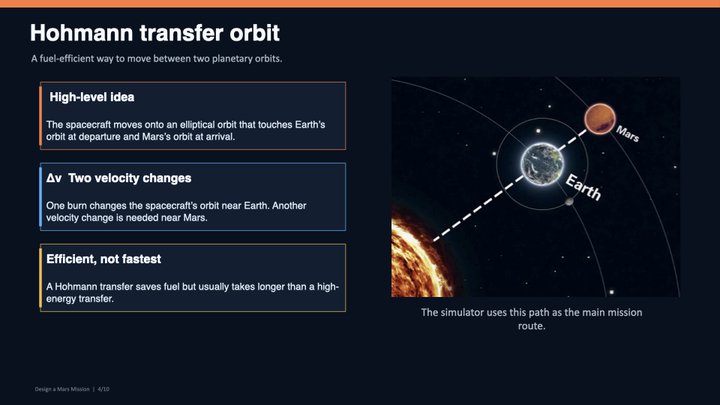
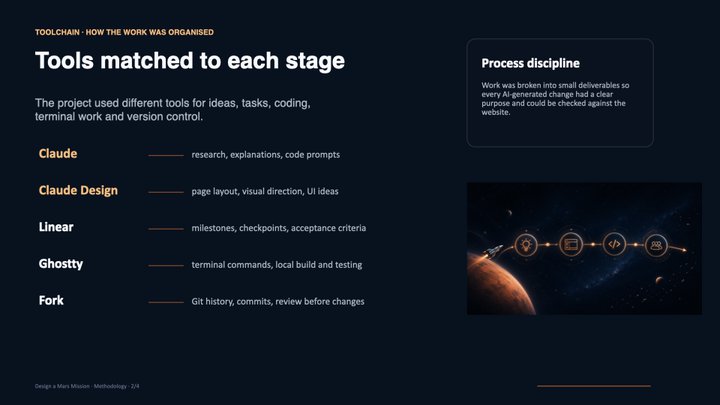
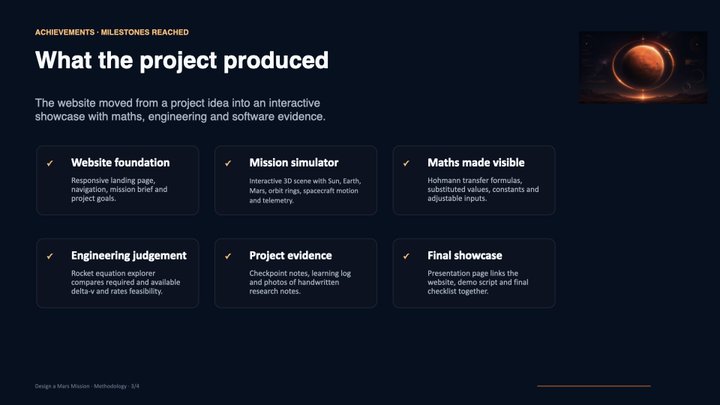
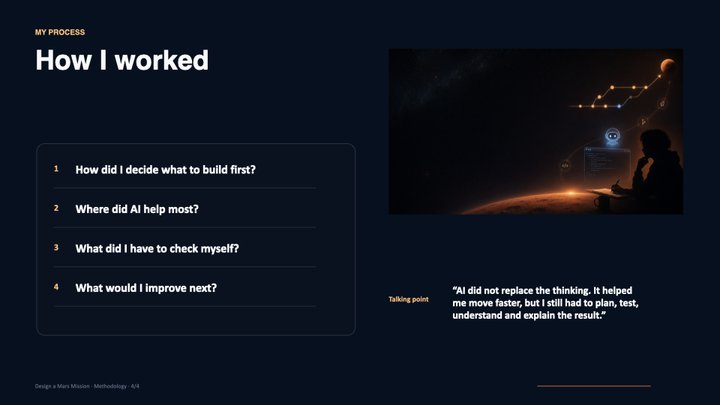
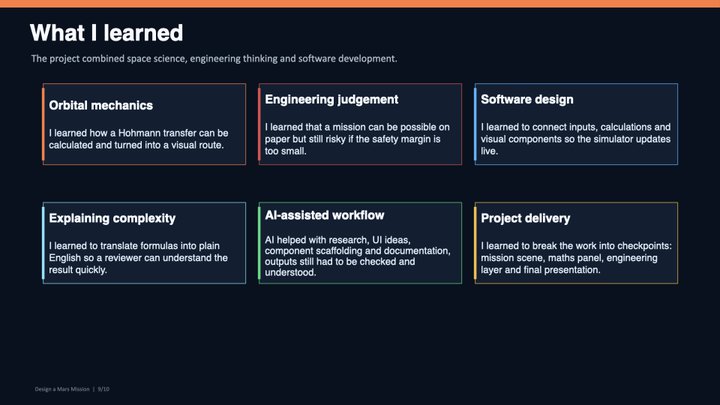
The final thirteen-slide deck, ready to present. Download the PowerPoint below, or preview the slide order underneath.
Five-Minute Final Demo
A timed, first-person script. Jump to any page with the buttons, then follow each step in order.
Introduce the project
My project is called “Design a Mars Mission”. I built an interactive web app that uses simplified orbital mechanics to calculate and visualise a journey from Earth to Mars. My aim was to combine maths, engineering and software in a way that is interactive and easy to understand.
Demonstrate the website
On the Mission page the app shows the Sun, Earth, Mars and the calculated transfer path. The route is not just a decorative animation, it is generated from the mission calculation. When I change a value the visualisation and results update with it.
Explain one maths formula
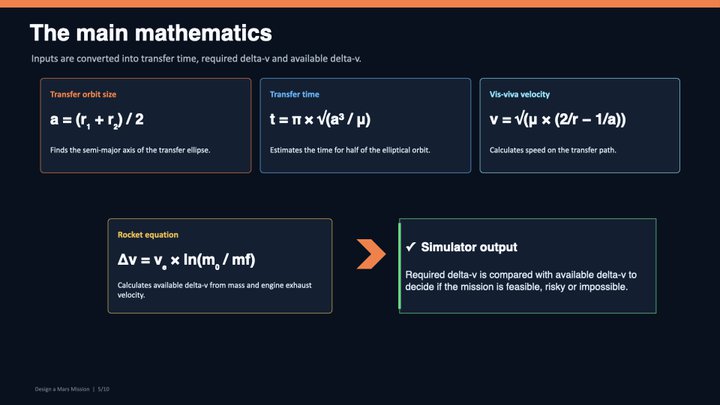
This is the rocket equation, delta-v = exhaust velocity times the natural log of initial mass over final mass. The exhaust velocity is the engine efficiency, the initial mass includes the fuel, and the final mass is the dry spacecraft. The simulator compares this available delta-v with the amount the Mars transfer requires.
Explain engineering trade-offs
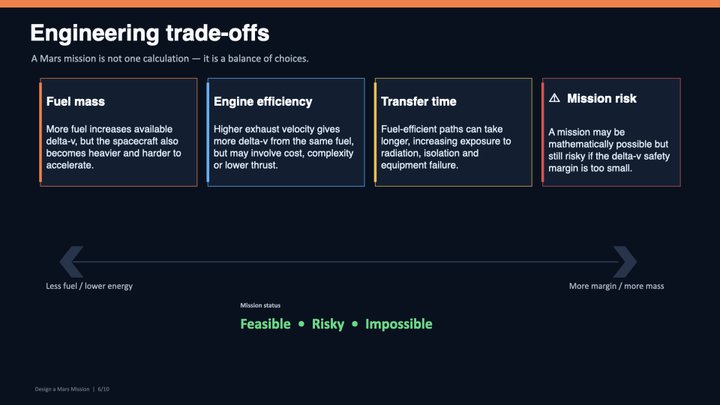
A mission is not automatically good just because the calculation works. Engineers balance fuel mass, engine efficiency, journey time and risk. More fuel raises available delta-v but also makes the spacecraft heavier, and a faster journey needs more energy.
Explain the software
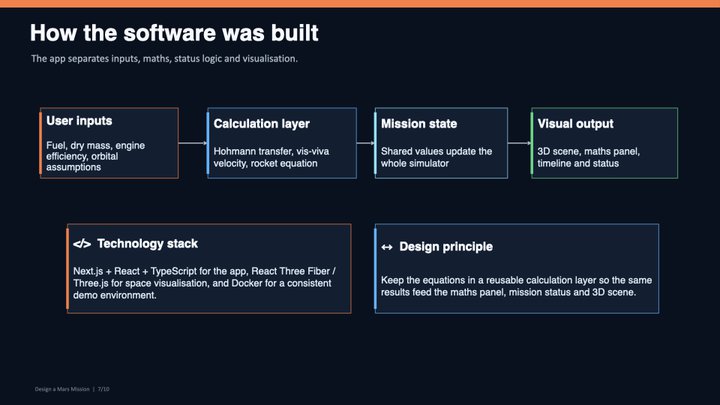
I built the project as a Next.js and React app in TypeScript, with Three.js for the 3D scene. The maths lives in separate calculation modules that the pages import, and those results drive both the interface and the visualisation. I run it with npm during development, and it can be built into a self-contained image with the included Dockerfile.
Learning and conclusion
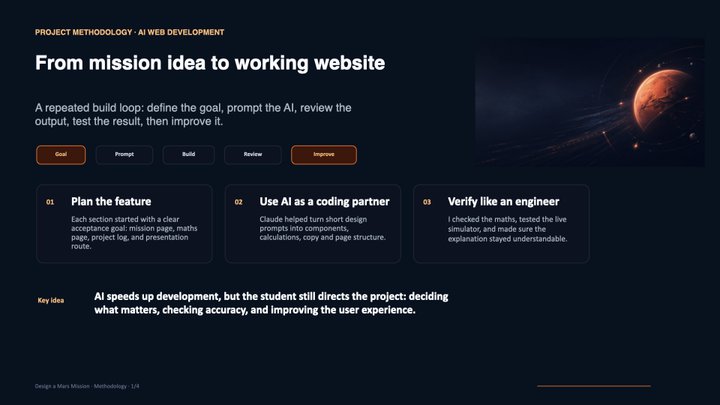
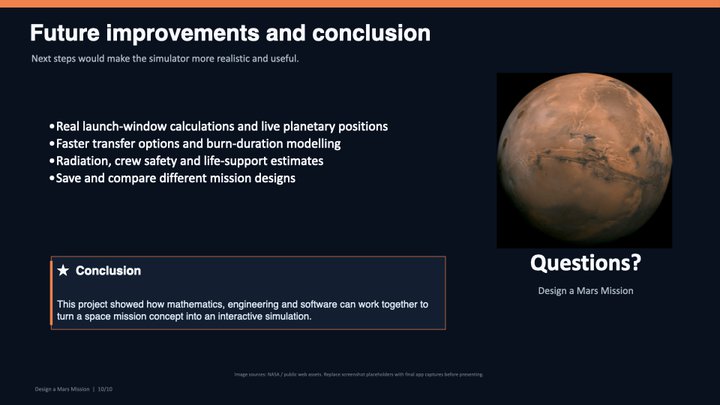
The main thing I learned was how maths can be turned into working software and then explained visually. I also learned to break a large problem into stages, validate my calculations, and use AI tools to support research, design and debugging. A future version could add real launch windows, live planetary positions and radiation estimates. This project showed how maths, engineering and software work together to turn a Mars mission idea into an interactive simulation.